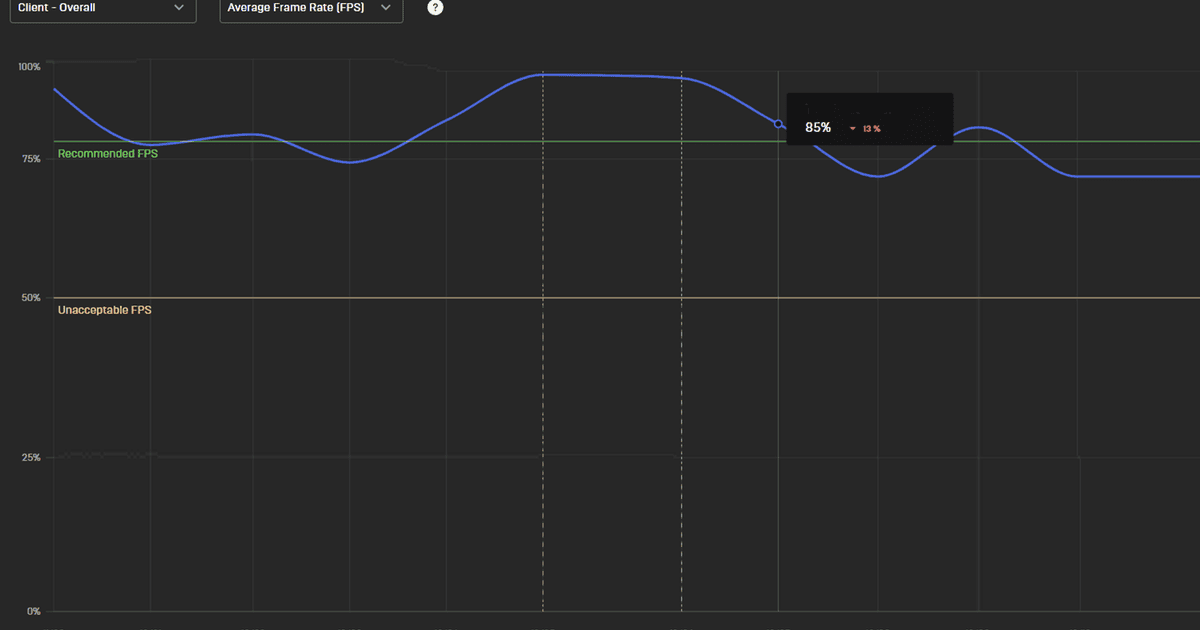
The Fortnite Creator Portal Technical dashboard shows you whether your island is crashing, stuttering or putting too much strain on Fortnite’s servers. To find it, sign in to Creator Portal, open Projects, choose your island and select Technical.
The v43.00 update brings those figures together in Client and Server reports. If players say your map is lagging, these charts help you work out whether to investigate the devices they’re playing on or the island’s server workload.
Where is the Fortnite Creator Portal Technical dashboard?
Select Technical from the project’s navigation, then open the Client or Server tab. Client reports describe what happens on players’ devices. Server reports show how much processing time and memory Fortnite needs to run a session.
Fortnite Creator Portal Technical dashboard navigation is inside each project. Official Epic Games Creator Portal artwork, shown for context rather than as a new performance chart.
Check both tabs after an update. You might see smooth gameplay on your own PC but a high hitch rate on mobile, or find that every player in a crowded session is affected by slow server frames.
What do the Client charts show?
The Fortnite Creator Portal Technical dashboard has three client charts: Client Crashes, Hitch Rate and Missed Frames. Client Crashes is the percentage of player sessions ending in a crash, with filters for platform and memory or non-memory causes.
For example, 20 crashed sessions out of 1,000 gives a 2% crash rate. It doesn’t necessarily mean 20 different people were affected. Some platforms do not supply non-memory crash data, so their displayed rates can look better than the real experience.
Hitch Rate measures stutters per minute. Epic describes under roughly 2.5 to 3 as generally healthy. Missed Frames measures how often a frame wasn’t drawn on time, which can make movement feel choppy.
Use the results to narrow your testing. A rise in hitches after you add a large effects-heavy area could point towards particle effects, mesh complexity or asset streaming. Try that area on an affected device, make one targeted change and check whether the rate improves.
Fortnite Creator Portal Technical dashboard server metrics
The Server tab contains Frame Time, CPU Usage and Memory Usage. Its graphs display an average and a P95 reading. P95 is the value that 95% of samples fall at or below, so a high P95 with a low average can reveal short periods when the server struggles.
| Chart | Meaning | Guidance |
|---|---|---|
| Frame Time | Time to process a server frame | Under 33.3 ms |
| CPU Usage | Share of a server CPU core used | Under 75% recommended |
| Memory Usage | Server memory in GB | Compare with top islands; no fixed limit |
Fortnite servers target 30 FPS, allowing 33.3 milliseconds to process each frame. When frame time rises above that budget, players may notice lag or rubber-banding. If CPU usage is high too, investigate Verse loops, always-active devices, physics objects and heavy spawning events, using profiling data to identify the actual bottleneck.
Memory usage is measured in gigabytes. Epic provides a top-island comparison rather than a universal pass-or-fail limit. Watch for a jump after you add new content, and check which assets or systems are responsible before cutting things from your map.
Use the Fortnite Creator Portal Technical dashboard after an update
Choose Highlights, then Release changes, to place release markers on your graphs. If your server frame time jumps on the day you add a new gameplay system, that update gives you a useful place to start investigating.
Look across several days rather than judging a single hour. Server intervals with too few sessions may be hidden. If you find a consistent problem, our UEFN MCP profiling guide explains how an agent can inspect profiling captures, suggest a change and compare the results.
Fortnite Creator Portal Technical dashboard benchmarks
The Fortnite Creator Portal Technical dashboard offers a Top islands benchmark for Client Crashes and Memory Usage. It compares your figures with the median across Fortnite’s 1,000 most-engaged islands, regardless of genre. Frame Time and CPU Usage have fixed recommended limits instead.
You can also export a chart using its Download icon. Treat the Fortnite Creator Portal Technical dashboard as an early-warning tool: check it after releases, investigate the affected metric in UEFN and test your fix before publishing again.
Official source: Epic Games Technical Performance documentation.